Journal of Accountancy,
August 2014 Excel Reader Challenge
Summary of Reader Solutions by J. Carlton Collins
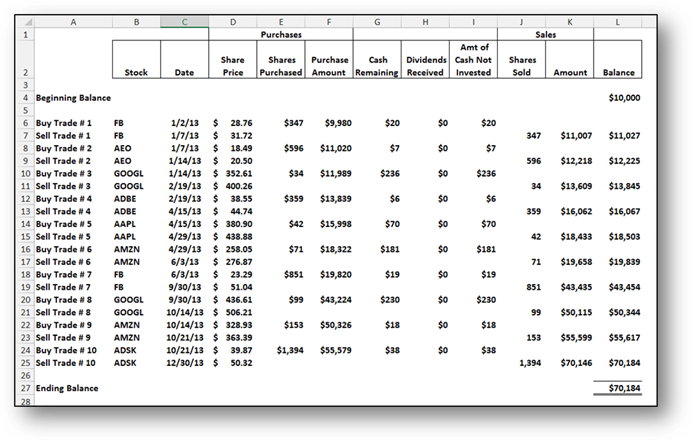
You can download Amir’s
solution at www.CarltonCollins.com/amir.xlsx.
Many readers, including myself, had trouble using Excel’s Solver because
this tool is limited, as follows:
In Excel Solver, the number of variables is
limited to 200, and the number of constraints you can apply to
non-decision variables is limited to approximately 100 (depending on
whether you use a linear or nonlinear model) and the specific
configuration of the constraints.
I got around these
limitations by dividing my solution up into 4 solver calculations, each
solving one quarter of the entire problem, and then combining the
results.
Amir ingeniously got around this
problem by creating calculations that simplified the problem into a 52
week numbers problem, expressed as integers.
(In contrast, I solved for both
the ticker and buy/sell date combinations, which resulted in more much
computing power than Excel Solver could handle. Amir used calculations
to reduce the ticker and date combinations down to just 52 weeks, and
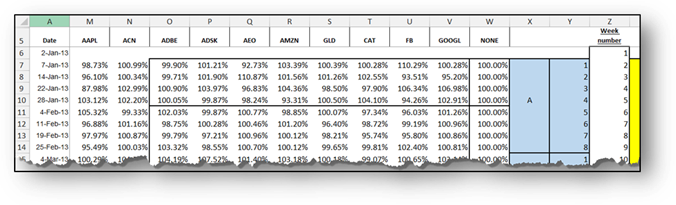
Solver was able to handle this simplified approach.) You can see
where Amir accomplished this in the screenshot below – he calculated the
weekly returns in columns M thru
V, and then assigned a week number to each week in
column Z.
Thereafter, he used
Solver to identify the specific 10 combinations of the 52 weeks that
would derive the top solution. The simplicity of this “week number”
approach can be seen in the following screenshot of Amir’s
Solver Parameters.
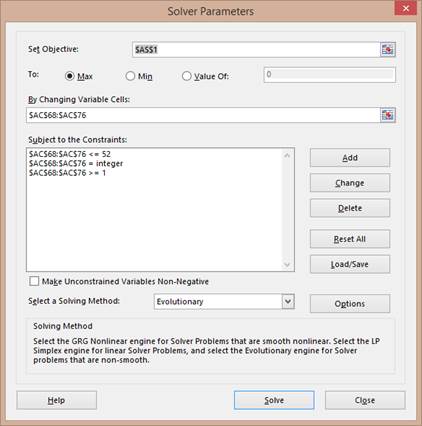
Amir’s
Objective cell (AS1 in this
example), was simply the product of the 10 weekly returns flushed out by
his calculations – Solver then calculated the many different combinations of
these weekly returns to maximize this amount.
Amir’s
first and third constraints
listed above (AC68:AC76<=52
and AC68:AC76>=1) simply
limited each of the ten week digits flushed out by his calculations to the
digits 1 to 52, as pictured in yellow below.
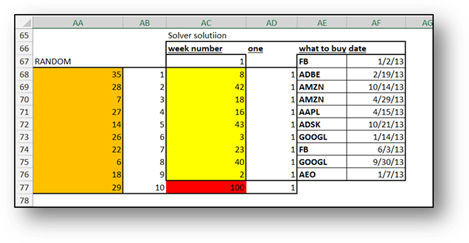
Amir’s
second constraint listed
above (AC68:AC76=integer)
limited these yellow cells to integers, so Solver would not attempt to
solver for fractional amounts.
I learned from this challenge that Excel’s solver
is limited, I was not aware of these specific limitations, although I
did understand that billions of calculations can overwhelm Solver.
Further, Amir’s solution helped me understand that Solver works best
when you can reduce your problem down to a simple series of integers. I
also learned that if you reached the limit of 100 constraints, you may
be able to overcome this obstacle by using the following steps:
1.
If you have
constraint cells containing simple formulas, such as =A1 (where A1 is a
decision variable), then these cells count against the limit of 100; but
if you apply the constraint directly to the decision variable cells
themselves, it won't.
2.
If a constraint
involves two or more decision variables, it might be helpful to place
individual limits on these variables instead.
3.
If you have
formula based constraints calculated into your worksheet, whose values
depend on the decision variables, then Solver treats them against the
constraint limit, even if they are decision variables. In this case, you
should replace these formula based constraints with individual cell
limits, if possible.
4.
If all else
fails, an excellent option may be to upgrade to Frontline's Premium
Solver Pro which has a limit of 1,000 constraints for linear problems,
and 250 constraints for nonlinear problems (apart from bounds on the
variables and integer constraints), and it can solve problems faster
than Excel Solver. In addition, Frontline’s Large-Scale GRG Solver
handles problems with thousands of constraints, in addition to bounds on
the variables. You can download a free 15 day trial of these Excel
add-in solutions at www.solver.com,
as pictured below.

I downloaded Frontline’s Premium Solver Pro and added it in to Excel and then used this solution, here is the solution’s ribbon toolbar.

I was particularly pleased that Frontline’s
Premium Solver Pro automatically detected and picked up the parameter
settings from Excel Solver, so I did not have to re-create them from
scratch.
I had always visualized
this challenge as a problem for Excel Solver, but some readers took
different approaches to solving this problem, a few of which are briefly
mentioned below:
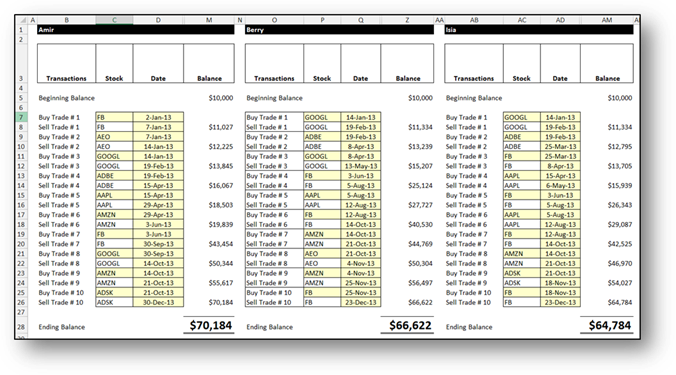
1.
Amir ($70,184) – As
discussed above, Amir used the
Solver approach to derive a maximum portfolio of $70,184.
2.
Berry ($66,622) – Berry’s
solution utilizes a series of
MAX functions to flush out the maximum gains for each holding
period, and then the MATCH
function to extract the corresponding date and ticker information for
those MAX gains.
3.
Isai ($64,784) – Isia used
an Array Formula approach to
derive a maximum portfolio value of $64,784.
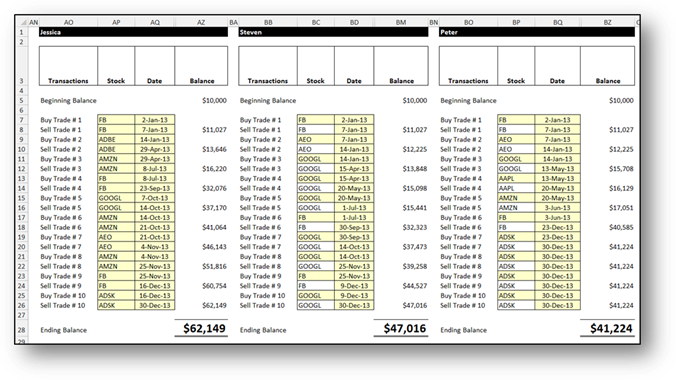
4.
Jessica
($62,149) – Jessica
calculated the XIRR for each
weekly trade for all stocks, and then extracted the highest 10 trades.
5.
Peter ($41,224) – Peter used
a LOOKUP, Formula, Sorting
and Filter approach to
derive a maximum portfolio of $41,224.
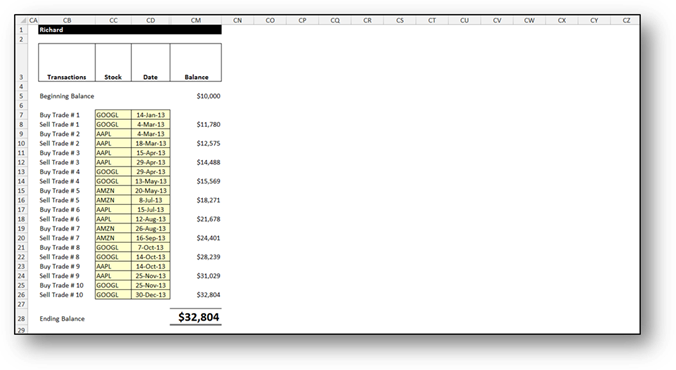
6.
Richard
($32,804) – Richard’s
solution derived a maximum portfolio value of $32,804 by calculating the
differences between the MIN and
MAX prices for each stock, and then eyeballing (apparently) the
results to pluck out the top trades.
Many readers indicated that they struggled with
this challenge and ultimately, many of them simply gave up. Kudos to
those readers who accepted the challenge, and put forth the effort to
submit a solution – you represent the cream of the crop.
Congratulations.